As Development Manager at Scientific Financial Systems, I focus on building robust, scalable solutions based on data science best practices. When I am not at work, my focus is on family and basketball. Yes, basketball has always been a passion for me. Not only do I enjoy playing the game, and collecting vintage throwback basketball shoes, but I am fascinated with the analytics behind NBA decision-making. I recently concluded the National Basketball Association (NBA) Future Analytics Stars fellowship program. I had a tremendous time learning from experts in the league office and with various teams about all the ways that data and basketball are growing together. The bottom line is that data science is driving improvements in analytics across verticals and that data science themes can improve analytics from basketball to finance and beyond.

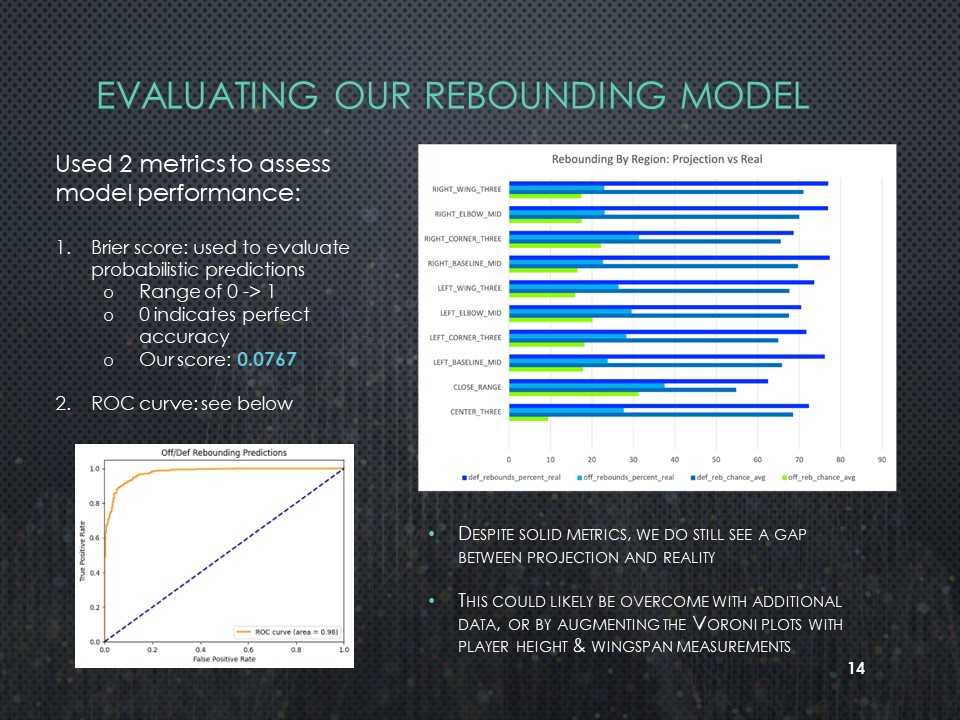
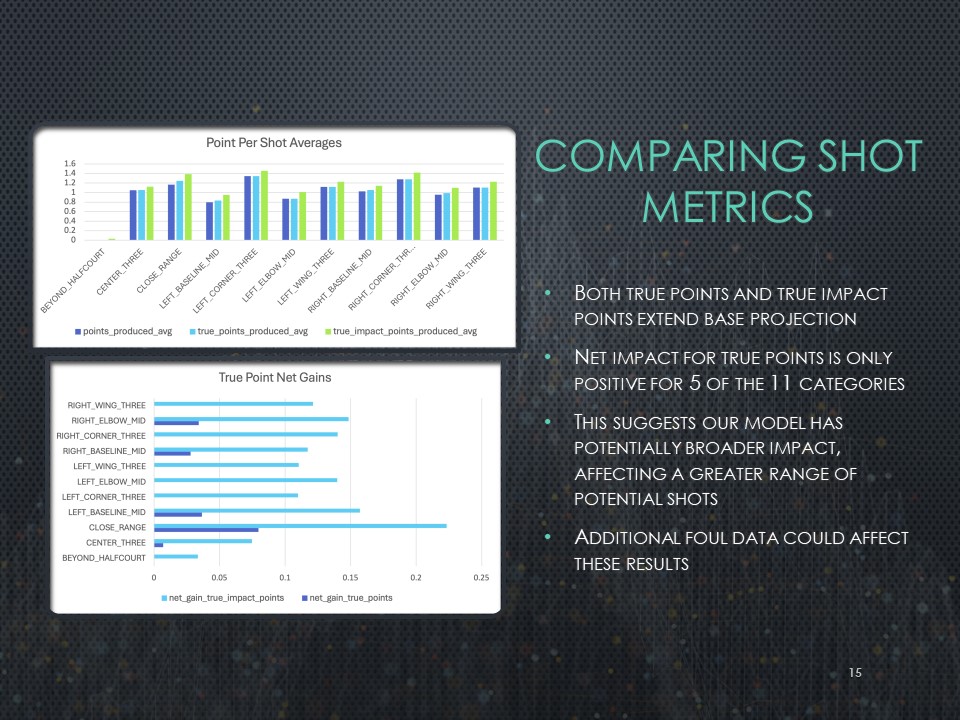
I was especially thrilled to participate in the Capstone Competition. I am pleased to announce that my novel tracking metric project, TrueImpactShotCharts, was selected as a winner and took home the popular vote! In this project, we created a unique model that leverages Voroni spatial diagrams and shot-region-specific rebound distributions to augment traditional point-per-possession projections with expected offensive rebounding value, and fed that into topographical shot charts to provide a fuller context to player shot-selection decisions.
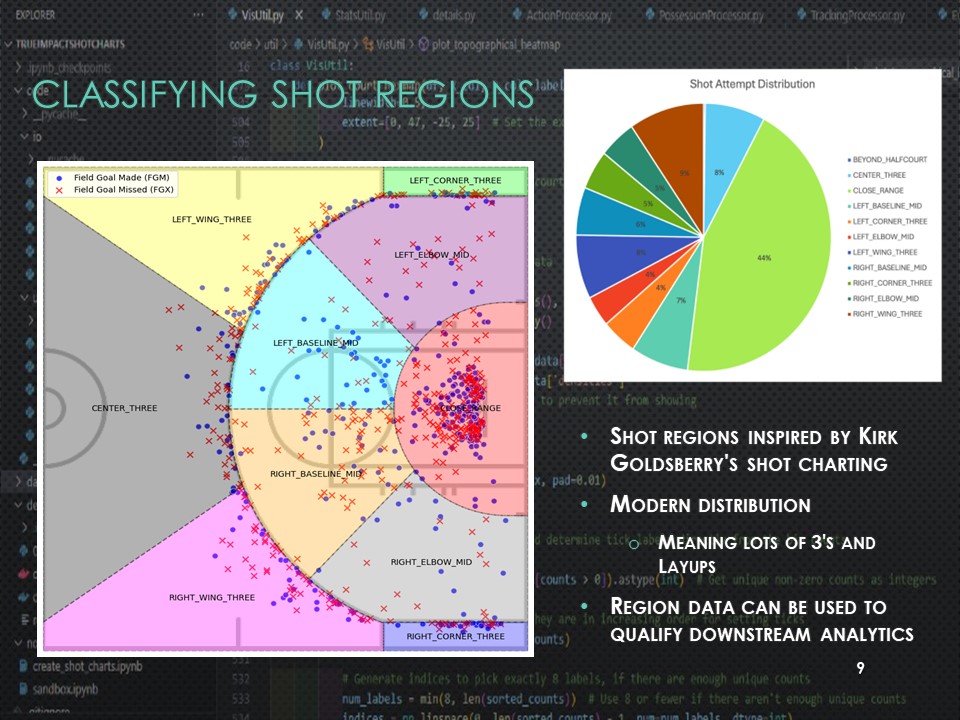
The True Impact Shot Charting project was an in-depth analysis and visualization endeavor to provide a comprehensive understanding of shot efficiency and player movements on the basketball court. The primary focus was to develop advanced metrics and visual tools that go beyond traditional shooting statistics, incorporating spatial data to offer insights into players’ shooting patterns, defensive effectiveness, and overall game strategy. Key components included the calculation of True Points Produced (TPP), which integrates both the value of the shot and the context in which it was taken, and the development of shot regions based on court geography and player tendencies.

The project utilized extensive data preprocessing and feature generation, employing geometric models and vectorized operations to enhance performance and accuracy. By mapping shot attempt locations to rebound locations and overlaying Voronoi cells, we created a nuanced view of offensive and defensive rebound probabilities. Additionally, the integration of a ‘zone of death’ metric for transition defense provided further context for evaluating team performance in dynamic game situations. The final deliverables included detailed shot charts, visualizations, and a metric that combines these features into a Points Per Possession (PPP) framework, offering a richer narrative of player and team efficiency for coaches and analysts. This project not only improved our understanding of shooting efficiency but also provided actionable insights for strategic decision-making in basketball.

Data Science best practices are at the heart of how we set up TrueImpactShotCharts. Here are some key considerations for any analytics effort:
- Build an infrastructure with scalability in mind
- Develop a strong data foundation
- Organize data upfront to support analytics
- Take time to vet the data model
It was an absolute blast to work with current tracking data, and a privilege to be part of such an exciting and brilliant cohort of young professionals. Can’t wait to see where we all end up and what’s in store for basketball analytics in the years to come!
For more information on Koi’s True Impact Shot Charts project, please go to:
https://github.com/dkStephanos/TrueImpactShotCharts

